Today after the outbreaks of Covid-19 pandemic, human resource (HR) leaders and operations managers are required to lead the organizations in digital transformation for business growth. According to survey of Payscale in Hong Kong, the average basic annual salary of a Analytics Manager is HK$638,713. In 2019, a study of myHRfuture revealed that 28% of respondents rated “people analytics” as the most-wanted competency.
Managers in people operations need to examine staff data and conduct simple surveys to derive insights and align decisions with strategic corporate objectives. However, they cannot solely depend on expensive consultancy or the busy in-house data analysts to perform these simple tasks for them. Managers equipped with Self-service People Analytics skills can help themselves to tackle this pain point without external assistance and within limited time and resources.
Problem-solving and Decision Making in Digital Era
簡介:
Problem-solving skill is an important for managers at all level. With sound knowledge in analysis of problems and give recommendations, effective managerial decision can be made. Modern tactics and skills can build upon prior experience and improve both individual and team performance in the current digital era.
目標:
This workshop will use exercises and cases to provide participants with both problem-solving and decision-making experiences. Participants can apply the processes and tools for working on solving problems in the workplaces. At the end of the workshop participants will be able to: • define problems with clear and effective manner; • generate a wider variety of quality and useful solutions • support more structured analysis of recommended scenarios leading to better decisions • recognize and avoid common mistakes
Target Audience:
Middle Managers
Newly promoted supervisor/officers
Anyone who would like to equip themselves with up-and-coming techniques, knowledge and increase their “power” meeting the coming challenges in workplace.
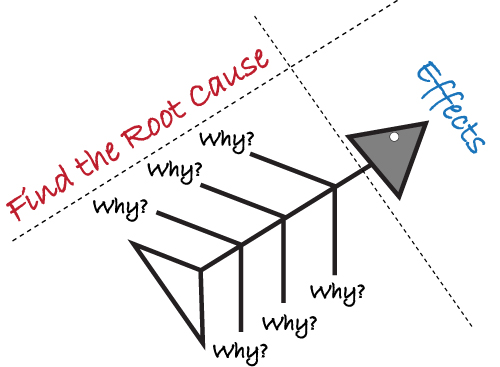
5 Whys and Fishbone Diagram are effective tools that can be used to locate the roots causes of a problem.
5 Whys is a problem solving tool that helps to get to the root of a problem. The basic idea is to ask “Why?” whenever a problem is encountered. Typically, the initial response will not trace back to the root of the problem it will only be a symptomatic representation of the overall issue.
Fishbone Diagram goes by several names (Ishikawa, Cause & Effect, etc.) and there are a variety of ways to use. It is primarily a tool for organizing information to establish and clarify the relationships between an effect and its main causes. Fishbone Diagram is able to identify the root cause(s) of the problem so that collective actions can be taken to eliminate their recurrence, develop a picture composed of words and lines designed to show the relationship between the effect and its causes.
What is the target?
To understand the use of 5 Whys and Fishbone Diagram in Analyze Phase of a Six Sigma Project
誰適合參加?
First and second level team leaders and managers
Quality and process improvement professionals
Those who are interested to become Lean Six Sigma professionals
Teaching Methodology
Interactive workshop and lecture
證書
Certificate of Successful Completion will be awarded to students who have achieved attendance criteria.
Fee
專業資格註冊名單: HK$750
Six Sigma Community Buddies /Members of SSI Partners: HK$800
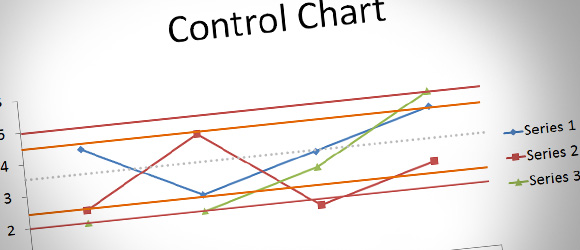
Control Charts are used in a number of places help control in a process. Control charts are used in a number of places in the Lean Sigma roadmap to test whether a process is stable and in control. By making use of control charts, 統計過程控制 (SPC) can then be applied to help control a process.
Control Charts are time charts designed to display signals or warnings of special cause variation. Special cause variation, as distinct from common cause variation, refers to changes in process performance due to sporadic or rare events indicating that a process is not ‘in control.’ The advantage of Control Charts is that they enhance the understanding of process variation making it easier to take action to reduce special cause variation and improve ongoing process performance.
What is the target?
To know about common types of control charts
To know how to use the control charts effectively
誰適合參加?
First and second level team leaders and managers
Quality and process improvement professionals
Those who are interested to become Lean Six Sigma professionals
Teaching Methodology
Interactive workshop and lecture
證書
Certificate of Successful Completion will be awarded to students who have achieved attendance criteria.
Fee
專業資格註冊名單: HK$750
Six Sigma Community Buddies /Members of SSI Partners: HK$800