Application of Statistical Process Control
簡介
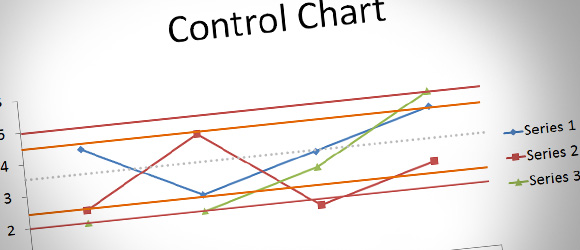
Control Charts are used in a number of places help control in a process. Control charts are used in a number of places in the Lean Sigma roadmap to test whether a process is stable and in control. By making use of control charts, 統計過程控制 (SPC) can then be applied to help control a process.
Control Charts are time charts designed to display signals or warnings of special cause variation. Special cause variation, as distinct from common cause variation, refers to changes in process performance due to sporadic or rare events indicating that a process is not ‘in control.’ The advantage of Control Charts is that they enhance the understanding of process variation making it easier to take action to reduce special cause variation and improve ongoing process performance.
What is the target?
- To know about common types of control charts
- To know how to use the control charts effectively
誰適合參加?
- First and second level team leaders and managers
- Quality and process improvement professionals
- Those who are interested to become Lean Six Sigma professionals
Teaching Methodology
Interactive workshop and lecture
證書
Certificate of Successful Completion will be awarded to students who have achieved attendance criteria.
Fee
- 專業資格註冊名單: HK$750
- Six Sigma Community Buddies /Members of SSI Partners: HK$800
- 其他: HK$850
授課語言: 廣東話 (supplemented with English)
地點: 單位 1627, 16/知名, 星光行, 沒有. 3 梳士巴利道, 尖沙咀, 九龍 *map*
CPD信用: 3.5 credits